Features
checkDisplay your data flexibly in Weebly from Google Sheets, Excel or any other spreadsheet.
check
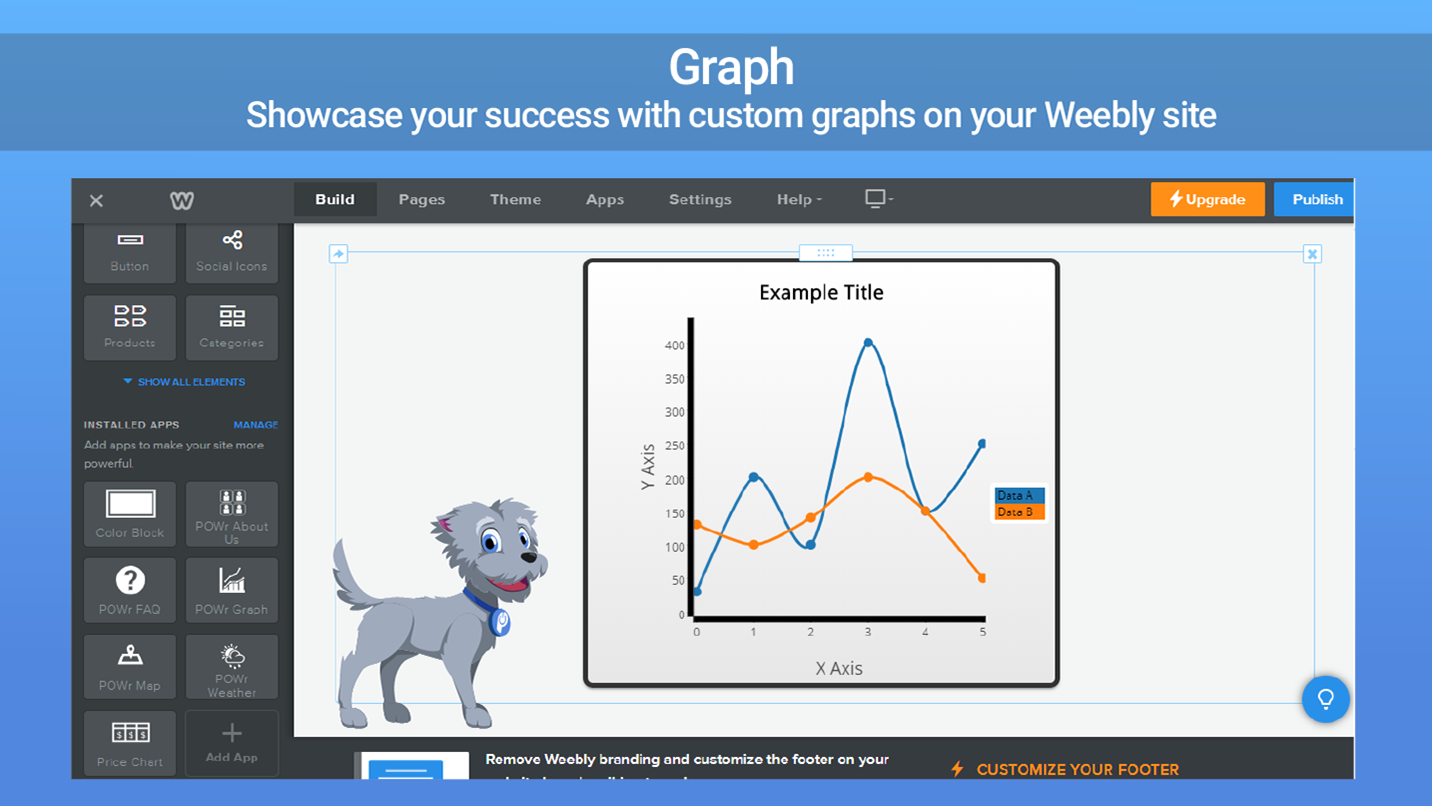
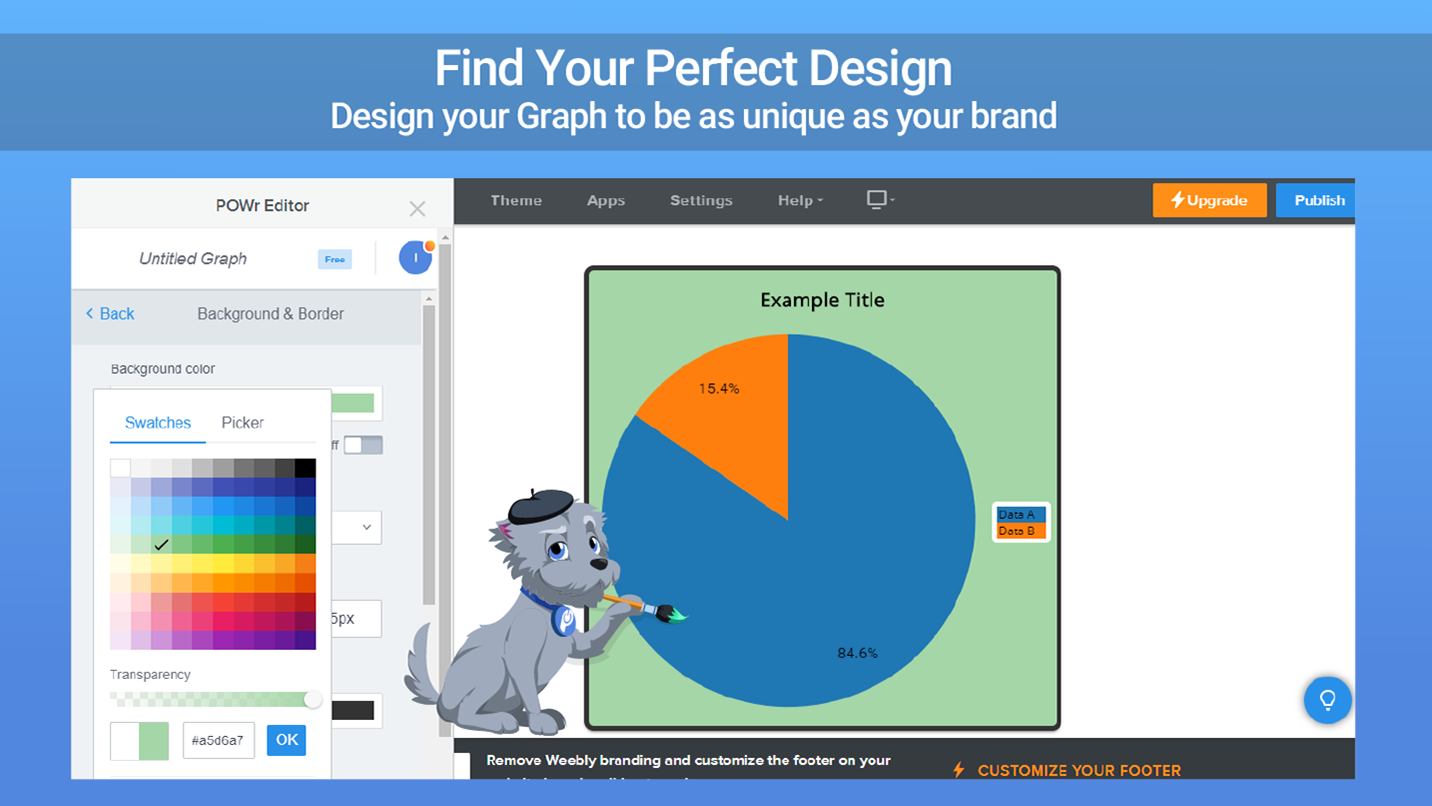
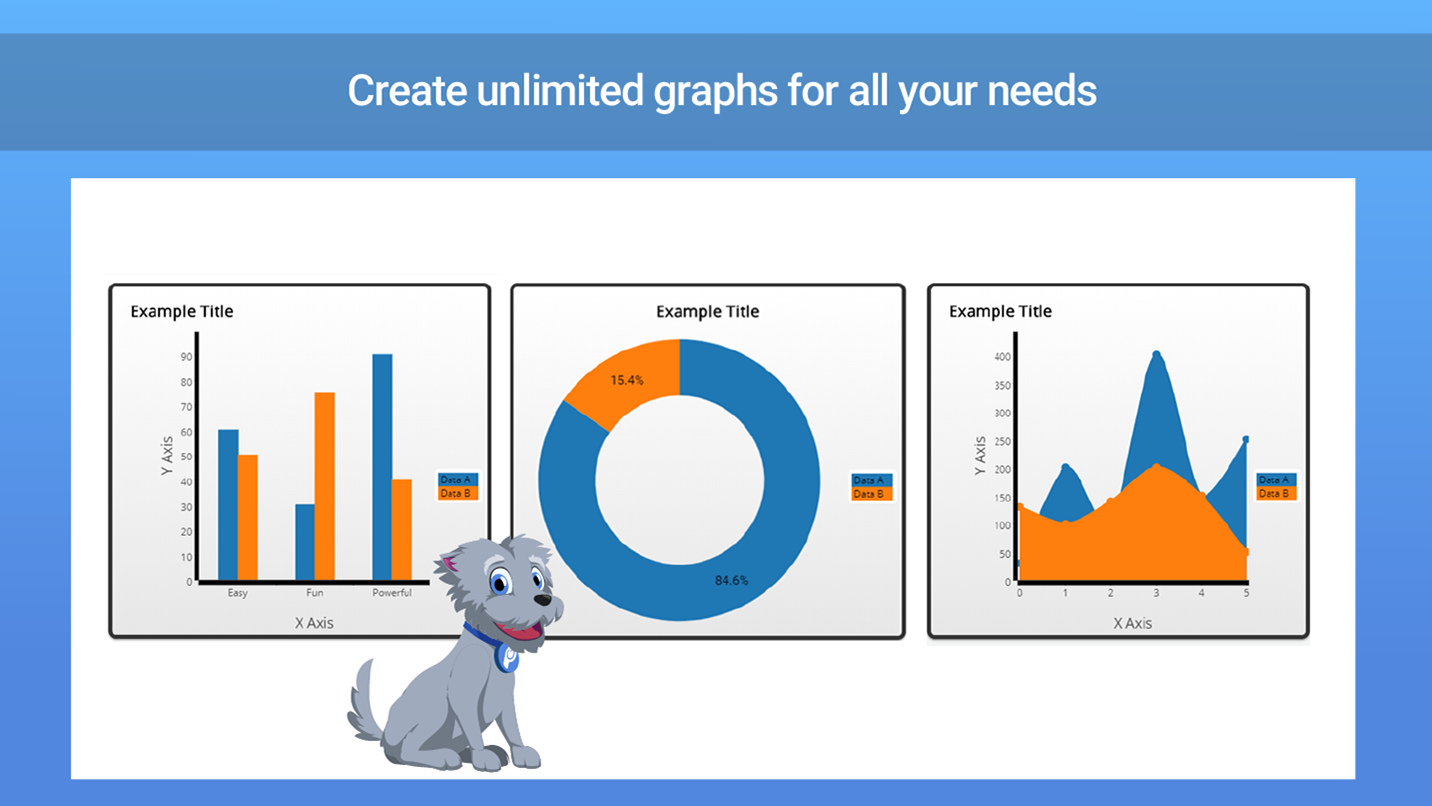
Choose your format - from pie charts, line plots, bar graphs, and more. Choose your colors and sizing too.
check
Show your growth, track trends and boost customer confidence by displaying your data on your site.
About
POWR Graph is the smart, flexible way to display data in Weebly. Paste in cells from Excel, Google Sheets, or any other spreadsheet. Select from multiple formats - pie charts, line plots, bar graphs, and scatter charts. Show your company’s growth, make predictions, or compare yourself to the competition.
Best of all, POWR Graph is mobile responsive on any device, and works in any Weebly theme!
Adding POWR Graph to Weebly
- Click the blue Add button.
- Drag the Graph element onto your page.
- A new graph will appear!
Setting up POWR Graph
- Click the new Graph to open the POWR Editor.
- Enter a title and data in the Content menu.
- Set colors and sizing in the Design menu.
POWR Graph is 100% free!
Or upgrade to remove the POWR branding and get advanced features.
Stuck?
Get in touch with our support team - we’re here to help.
Or visit our Help Center for common questions.
See more free apps for Weebly
Pricing
$0
$4.99/mo
$11.99/mo
Customize fonts, colors, and more.
Remove POWr branding from unlimited Graphs.
Unlock advanced features, such as bigger data sets, graph styles, and custom CSS.
Reviews
-
Weebly User Feb 22, 2025Can't organize or design my graph!
-
Emily Ostlund Feb 15, 2023Data did not stay where I put it. Columns disappeared if I hit backspace white typing. Had to repeatedly enter the same data for a second graph, but it never displayed correctly, and upon closing, would default to the preset data, not the data I put in.
-
Conner Braun Mar 17, 2020Tried to use pie chart. Didn't work after closing edit box.
-
Aice Marine Project Apr 17, 2019Had trouble inputting data. This app says you can customize color but changing the graph colors is impossible.
-
Anne Van Druff Dec 01, 2018Terrible app. It couldn't save any data. Tried 3 times. Not worth it.
-
Cassy DenHartog Nov 28, 2018I'd give it 0 stars. Doesn't take correct data. Not easy to use. Does not let you easily see the graph you're creating. Overall it was useless for what I needed.
-
Jaysen Paulson Oct 03, 2018Does not properly take information, won't display axis information. Don't use.
-
Jennifer M Woodley Jan 08, 2018This app is horrible and does not work. Trying to input data was the most frustrating thing I have experienced in a long time. Pressing the backspace or delete button (just to delete a letter) would delete a whole column or row, and change the entire layout. Trying to capitalize any words was impossible. Terrible.
-
Pentafax Jul 15, 2017Parece una buena herramienta! veremos!
-
Missy WarNut Dec 08, 2016This App is not usable. I tried inputting data and it doesn't work because whenever I pressed the back/delete button, I lost an entire column- basically forcing me to start everything all over again. Tired this on both Safari & Google Chrome. This App just doesn't work.


